
Interview with Damiaan van Hartveld
- Mar 5, 2024
- 6 min read
Updated: Oct 15, 2024
Damiaan van Harteveld (26 years old) completed his master's degree in GIS and Remote Sensing at Wageningen University a few weeks ago. I ran into him on the train and we started an interesting conversation. What exactly is GIS and what does spatial planning have to offer?
You studied Spatial Planning and Human Geography in Utrecht from 2016 to 2020, why did you go to Wageningen for the Master's in Geo-information science?
My sister did her bachelor's and master's in Wageningen. I heard good stories from her. I was looking for GIS study and it turned out that the best course of this study could be found in Wageningen. After my exchange, I also felt like going to another city; to have a different fresh vibe. And the campus is also a lot nicer. Since then, I haven't regretted it for a second.
What is Geo-information Science?
GIS is engaged in performing analyses with data that has a location. Research shows that 80% of the data has a location (the so-called geo-data), with which you can of course do a lot. All quantitative analyses that you can do with this actually fall under the heading of GIS.
In 2022, you started your master's thesis for GIS. How do you use geo-information in your master's thesis?
My master's thesis was about forest fires. Wildfires need three components to form: fuel, oxygen and an ignition temperature, the well-known combustion triangle. Oxygen is impossible to remove. The same goes for the ignition temperature: sometimes it just gets very hot due to natural circumstances, someone throws a cigarette on the ground or fires are lit on purpose, the latter unfortunately happens often. Only the fuel of a forest fire can really be addressed: if vegetation is removed, the fire cannot spread or spread less quickly.
During my thesis, I developed an AI model that determines which spatial layout of flammable vegetation is best to prevent future forest fires. The algorithm serves three purposes. Firstly, the total area under burnt area must be as small as possible, secondly, the number of houses covered must be as low as possible and, thirdly, the costs of removing vegetation must be kept as low as possible. The AI, the genetic algorithm (multi-objective optimization; Non Dominant Sorting Genetic Algorithm (NSGA) II specifically), can determine the optimal place to remove vegetation for each budget option. In practice, as with any problem, there is only limited money available. That is why this method is a very suitable planning tool.
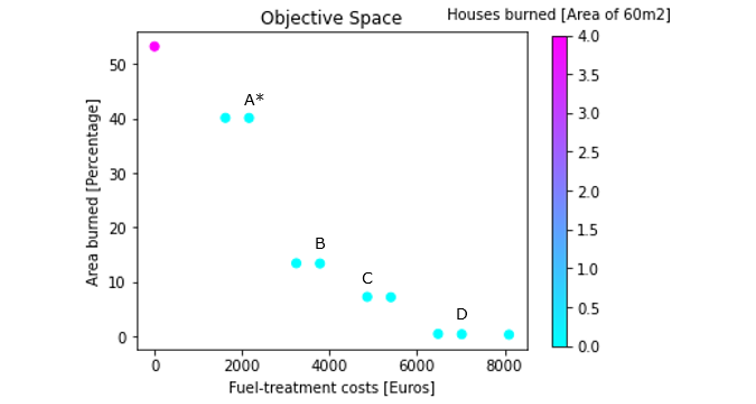
Figure 1: Pareto front of optimal vegetation removal configurations
To make this AI work, I first programmed a wildfire simulation model that simulates how a forest fire will spread based on certain assumptions and conditions. There are existing models for fire propagation, but they differ in precision and some are very time-consuming for a simulation: up to 4 days. My own model is fast, but unfortunately less realistic because of that: it runs 120 simulations in a minute.
The model tests how well removing vegetation limits the spread of fire. The AI sometimes removed strips of forest in very logical places, so that the fire did not spread far, but sometimes it didn't. The genetic algorithm combines parts of the best cards (crossover; just like in genetics), until the new cards were no longer better than the older ones. This is called convergence.

Figure 2: Results of the case study
Figure 3: Workflow of the genetic algorithm (the AI model)
For the last six months, you have completed an internship at Geokapti, a company that specializes in earth observation, in The Hague. What were you doing there?
At GeoKapti, I mainly worked with remote sensing, something that is very interesting for spatial planning, because it is about the data collection behind spatial data. Remote sensing is concerned with measuring and observing the Earth's surface. This can be done with all kinds of measuring instruments, such as drones, but it is usually done with satellites that hover around the earth. These satellites capture light in different spectra, such as the visible red-green-blue light but also in the non-visible; infrared and microwave radiation. Each type of earth's surface reflects light in its own way, which makes them distinguishable. Based on this reflection, surfaces on the earth can be classified, without the need for high-resolution photographs.
At Geokapti I worked with two satellites, Sentinel 2 and Sentinel 3, to calculate the evapotranspiration (evaporation of water from the ground and vegetation) on an agricultural plot. This is a daily global algorithm that can calculate this evapotranspiration. If you know the evaporation, you can adjust the water use here and there is less irrigation required. This saves a lot of water and it is also better for the plant. If a plant receives an optimal amount of water, it is less susceptible to diseases. This also reduces the need to use pesticides.
A company like eLEAF is hired by the government to use this technique of remote sensing. By adjusting the water use to the mixed evaporation, they achieve up to 30% water reduction. Bizarre amounts of water are used in agriculture, not comparable to if you were to shower yourself, for example. Now that water will become increasingly scarce in the near future, this technique offers a solution.
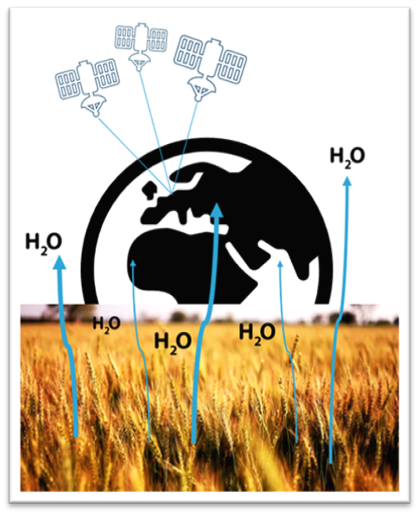
Figure 4: Remote sensing can be used to calculate evapotranspiration on an agricultural field
You completed a bachelor's degree in spatial planning in Utrecht until 2020. What do you think GIS spatial planning has to offer?
A lot. GIS allows you to literally map out what is going on somewhere. Sometimes you see things and think that things work in a certain way, but with data you can confirm or disprove this. Suppose you want to determine which route a train track should take between two cities. You could do this from the planner's expertise. However, people are biased and think different things are important. During my bachelor's degree, I noticed that there were often discussions between different students, where everyone had a good point, but they couldn't work it out together.
When you use GIS, you work with a quantitative basis: you make a decision based on variables with a weighting. If you have to calculate a route, you do this, for example, by giving the country where the train track could run a certain suitability value. This weighting is different for everyone, but then the computer can determine with a rational consideration where the track should be placed. The train track may be in a different place with each planner, but you know which variables this is due to. This gives you the opportunity to play with the weighting of the variables, and investigate where the middle ground is.
As it sometimes turns out, even if two planners have very different opinions about the suitability of the location for a train track, the train track still runs in the same place. It may be that you have very different opinions, but one does not exclude the other.
From your studies in Human Geography and Spatial Planning, you know that the human world is very complex. Can GIS also help with social problems?
Yes, because GIS often has a social side. For example, it can provide insight into places where people with a low income live. Or: show where covid ontbreaks are and where it is better to avoid a party.
During my bachelor's thesis, I also tried to measure social variables. At that time, the nitrogen quota had just been abolished. The introduction of the PAS anticipated nitrogen reduction in the future, which in turn gave more freedom to build. As a result, many farmers expanded their barns. You can see those stables very strongly in the landscape, which many people find very annoying. So I looked at all the agricultural area, focused on Groningen and Limburg and looked at whether the number of buildings on that area had increased. In the past, you might have to go to all those areas by bike, but with GIS this is much easier: there is simply a dataset in which all the buildings are listed.
I then did a literature review, in which I went deeper into the 'NIMBY' phenomenon. I didn't use GIS for this. However, that would certainly have been possible. For example, I could have mapped out whether the number of people who are annoyed by mega barns had increased in places where the number of mega barns had increased.
Finally: you also volunteered as a cartographer at Missing Maps, how does GIS help here?
When a natural disaster occurs, such as a major flood, earthquake or landslide, humanitarian aid is vital. However, aid depends on passable roads. In last year's earthquake in Turkey, entire areas were wiped out, and there were houses on the road. Then it is vital that you can quickly identify which roads are not affected. At Missing Maps you work together with a large network of volunteers, to map out which roads are still accessible and which are not.
Many people often think that GIS is very complex, but it doesn't have to be! Missing Maps shows you a satellite image and you indicate where a road is interrupted. It's an example of how GIS has a direct social impact today!

Figure 5: Missing Maps: how we work (https://www.missingmaps.org/)


Comments